Generating Asteroids
After watching this video I’ve become inspired to procedurally generate my own asteroids. I became even more intrigued when the video showed me how to combine functions to give such interesting results. However explaining how it works to friends and colleagues proved to be difficult. That’s why I’ve decided to compile the technique in a Juypter Notebook. You can find the original notebook at github as well as compute shaders in which I have implemented these techniques.
First things first
Before generating asteroids I need several helper functions to plot the data. The main idea is that we have a line made up of many points, and we’re going to write and combine functions that alter the height of each point based on their distance from the origin. We then generalize this idea to a circle. Here altering the height means placing the point further away from the center in the direction of the normal.
The implementation of these helper functions is not important right now, as long as you get the idea of what we’re trying to accomplish.
using XPlot.Plotly;
using System.Numerics;

public XPlot.Plotly.PlotlyChart LinearPlotChart(Func<float, float> function, string title, string xaxis, string yaxis)
{
    var data = new Graph.Scatter()
    {
        x = Enumerable.Range(0, 500).Select(xv => xv / 100.0f),
        y = Enumerable.Range(0, 500).Select(yv => function(yv / 100.0f))
    };
    return Plot(data, 0.0f, 5.0f, -2.0f, 2.0f, title, xaxis, yaxis);
}

public XPlot.Plotly.PlotlyChart Plot(Graph.Scatter data, float minX, float maxX, float minY, float maxY, string title, string xaxis, string yaxis)
{
    var layout = new Layout.Layout();
    layout.xaxis = new Graph.Xaxis() { range = new float[] { minX, maxX } };
    layout.yaxis = new Graph.Yaxis() { range = new float[] { minY, maxY } };

    var chart = Chart.Plot(data, layout);
    chart.WithTitle(title);
    chart.WithXTitle(xaxis);
    chart.WithYTitle(yaxis);
    chart.WithWidth(400);
    chart.WithHeight(400);

    return chart;
}

public XPlot.Plotly.PlotlyChart PlotAsteroid(Func<float, float> craterShape, string title, params Crater[] craters)
{
    var xs = new List<float>();
    var ys = new List<float>();

    for(float i = 0; i < (float)Math.PI * 2.0f; i += (float)Math.PI / 100.0f)
    {
        ComputeVertex(xs, ys, i, craterShape, craters);
    }
    ComputeVertex(xs, ys, 0, craterShape, craters);

    var data = new Graph.Scatter() {x = xs, y = ys };
    return Plot(data, -1.2f, 1.2f, -1.2f, 1.2f, title, "", "");
}

public float CalculateCraterDepth(Crater[] craters, Vector2 vertex, Func<float, float> craterShape)
{
    var craterHeight = 0.0f;
    for(var i = 0; i < craters.Length; i++)
    {
        var crater = craters[i];
        var x = Vector2.Distance(crater.Position, vertex) / Math.Max(crater.Radius, 0.0001f);
        craterHeight += craterShape(x);
    }
    return craterHeight;
}

public void ComputeVertex(List<float> xs, List<float> ys, float i, Func<float, float> craterShape, Crater[] craters)
{
    var x = (float)Math.Cos(i);
    var y = (float)Math.Sin(i);

    var vertex = new Vector2(x, y);
    var height = 1.0f + CalculateCraterDepth(craters, vertex, craterShape);
    vertex *= height;

    xs.Add(vertex.X);
    ys.Add(vertex.Y);
}

public struct Crater
{
    public Crater(Vector2 position, float radius)
    {
        this.Position = position;
        this.Radius = radius;
    }

    public Vector2 Position {get;set;}
    public float Radius {get;set;}
}
Generate the cavity
The main ingredient in a crater is the cavity (hole). The lowest point is at the origin of the crater. So I’ve chosen a square function as our basis.
display(LinearPlotChart(x => x * x - 1, "Basis function for cavity", "Distance", "Height"));
We can combine this function with the, quite boring, function y = 0 using the min operator to get something that already looks a lot like a crater
display(LinearPlotChart(x => Math.Min(x * x - 1, 0.0f), "First combination", "Distance", "Height"));
We then comebine this function on more time, now with the function y = - 0.2, to limit the depth of the crater
const float depth = -0.2f;
display(LinearPlotChart(x => Math.Max(Math.Min(x * x - 1, 0.0f), depth), "Final cavity function", "Distance", "Height"));
When we visualize this shape on a circle it already looks quite good, but we’re not there yet.
Func<float, float> craterShape = x =>
{
    var cavity  = x * x - 1;
    var combined = Math.Min(cavity, 0.0f);
    return Math.Max(depth, combined);
};

var radians = 0.4f;
display(PlotAsteroid(craterShape, "A circle with cavities", new Crater(Vector2.UnitY, 0.2f), new Crater(new Vector2((float)Math.Cos(radians), (float)Math.Sin(radians)), 0.1f)));
Generate the Rim
If you look at images of craters you see that they have a cavity, but also a rim around them, that is higher than the ground that is a bit further away. So we choose a function that starts high and slowly lowers.
const float rimWidth = 3.0f;
const float rimSteepness = 0.02f;
display(LinearPlotChart(x => ((x - rimWidth) * (x - rimWidth)) * rimSteepness, "Basis function for rim", "Distance", "Height"));
Combining this function with the cavity function using the min operator gives us a pleasing shape.
Func<float, float> craterShape = x =>
{
    var cavity  = x * x - 1;
    var rimX = Math.Min(x - rimWidth, 0);
    var rim = (rimX * rimX) * rimSteepness;
    var combined = Math.Min(cavity, rim);
    return Math.Max(depth, combined);
};

var radians = 0.4f;
display(LinearPlotChart(craterShape, "Combined cavity and rim function", "Distance", "Height"));
And it looks even better when applied to a circle!
display(PlotAsteroid(craterShape, "Combined function to generate craters", new Crater(Vector2.UnitY, 0.1f), new Crater(new Vector2((float)Math.Cos(radians), (float)Math.Sin(radians)), 0.1f)));
Smooth the functions
Using the standard max and min operators gives a few quite abrubt transitions. We can smooth these transitions using the techniques described here. Note that beacuse we use a polynomal smoothing algorithm there’s no beginning or end to the smoothing (as you would have with a simple lerp) so our whole circle becomes slightly larger as a result.
const float smoothing = 0.5f;

public float SmoothMin(float a, float b, float k)
{
    k = Math.Max(0, k);
    float h = Math.Max(0, Math.Min(1, (b - a + k) / (2 * k)));
    return a * h + b * (1 - h) - k * h * (1 - h);
}

public float SmoothMax(float a, float b, float k)
{
    k = Math.Min(0, -k);
    float h = Math.Max(0, Math.Min(1, (b - a + k) / (2 * k)));
    return a * h + b * (1 - h) - k * h * (1 - h);
}
Func<float, float> craterShape = x =>
{
    var cavity  = x * x - 1;
    var rimX = Math.Min(x - rimWidth, 0);
    var rim = (rimX * rimX) * rimSteepness;
    var combined = SmoothMin(cavity, rim, smoothing);
    return SmoothMax(depth, combined, smoothing);
};

var radians = 0.4f;
display(LinearPlotChart(craterShape, "Function", "Distance", "Height"));
Applying this function to our circle gives our final result.
display(PlotAsteroid(craterShape, "Asteroid", new Crater(Vector2.UnitY, 0.1f), new Crater(new Vector2((float)Math.Cos(radians), (float)Math.Sin(radians)), 0.1f)));
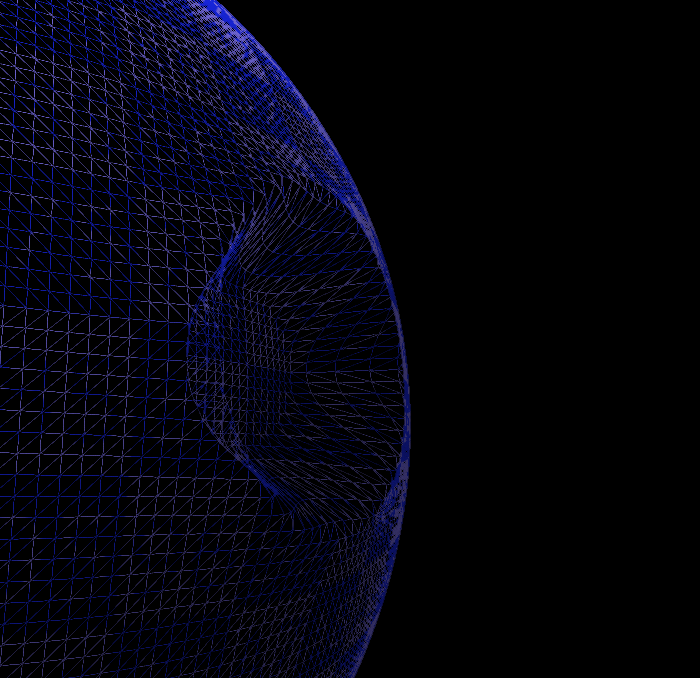
I’ve used this technique in my open-source 3D Engine where it looks like this:
- roytries
- roy-t
- roytri